|
TLDR: I like Power Rankings and post them every week, for a bit of fun.
I've been playing around with power rankings for the NRL for a few years now and have made some interesting improvements and a bunch of even more interesting mistakes. I'm pretty happy with the current model after adding a few features over the years. I've also updated the scale and adjusted a few variables to cater (hopefully) to a broader audience. The system I use is subject to change, hopefully for the better. How does the system work? My NRL Power Rankings ("PR) started as a simple ELO system borrowed from the one originally created by Arpad Elo to rank chess players and more recently applied to a number of sports including soccer and NFL. The system is used to follow trends and generate a predictive formula to suggest probability of victory in future games. Pretty simple concept? They always start out that way... Wikipedia: The ELO rating system is a method for calculating the relative skill levels of players in competitor-versus-competitor games such as chess. It is named after its creator Arpad Elo, a Hungarian-born American physics professor. The formula for ELO is fairly straight forward, although it has been altered to suit various sports: (from www.eloratings.net). If you're into the maths of the system, this is a great place to start. If not, the formula and description below should be enough to get by: Rn = Ro + K × (W - We) [New PR] = [Old PR] + [Margin of Victory] x ([Result] - [Likelihood of Victory]) My PR use the same base formula but have some scaling and tweaks to a couple of the variables: K varies in the following way:
K scaling by margin is based on historical scores for the NRL to reflect the likelihood of a margin of victory. A win by 40 points or more occurs in less than 5% of matches and is therefore weighted higher than a win by 10 points or less (50% of all matches). There are diminishing returns for margin of victory with a 100 point win only marginally worth more than a 50 point win - neither is at all likely. Home ground advantage is reduced by 50% for matches outside a team's traditional home area - eg home games taken to Darwin, Perth or Adelaide are less of a home ground advantage. It could be argued that the home ground advantage could be applied to the away team in situations like Souths having home games against North Queensland in Cairns. I may look into this if I add in future factors such as travel and days rest. For now, I'm keeping it relatively simple. Rather than a traditional 1,500 median scale, I've converted scores into a 0-100 scale which looks and feels more relatable. While it's possible to exceed 100 points or drop below 0 points, in more than 100 seasons this has never happened. PR gains and losses essentially scale based on two key variables: the margin of victory and the likelihood of winning. A larger margin generates a greater change in PR. A bigger upset generates a greater change in PR. The scaling can mean that a heavy favourite might win by 30 and receive a smaller increase in PR than an underdog that wins by 10. This is very much intended. My PR use a standard zero-sum system. This means that if the winning team gains three points, the losing team loses three points. This prevents excessive inflation (and deflation?) of scores and rankings. It also means we can track against historical seasons in a meaningful way. I've set the key formula variables based on a few important criteria:
What these Power Rankings DO:
What these Power Rankings DON'T do:
This is not intended to be a replacement system for human interpretation of power rankings. There are pundits out there who do a very good job of identifying trends, as well as some who seem to be completely clueless - I'll let you make up your own mind on which experts fall into which category. This PR system is just another voice in the chorus. Take from it as much or as little as you like. The initial power rankings at the beginning of each season will likely be less reflective of actual results but over time should become more and more accurate. Round 1 is usually quite messy, in a similar way to the unpredictability of tipping competitions for the first few rounds. Teams rise and fall each season for expected and unexpected reasons. West Tigers in early 2018 are a great example of a team that was surprisingly successful for a number of weeks. At the start of each season all PR are adjusted towards the mean (50) by a % factor. This essentially evens the competition at the start of the season by reducing the teams finishing the previous season with a PR above 50 down towards the mean and teams below 50 up towards the mean. Can I use these Power Rankings to make me rich? Probably not. If my system was good enough to make reliable money, do you think I'd be sharing it publicly? The intent of the system is to have a bit of fun with data, look at trends in team performance and add a little interest to the NRL season. You might be able to use them to make your tipping or gambling slightly more successful but I wouldn't be putting my house on it. Historical Data My system uses data that goes back to 1908 and has every result from the NSWRL, ARL, Super League and NRL eras. There have been a number of end of season adjustments when teams have been added, merged or have left the competition. There have also been a couple of full resets (all teams revert back to 50PR) at the beginning of the Super League in 1997 when the competition was split in two and the start of the NRL era in 1998. Power Ranking examples NSWRL Round 1 1908 - Norths @ Souths
NRL Round 1 2018 - Brisbane @ St George Illawarra
What's next? I'll continue to post the NRL Power Rankings on /r/NRL with a copy here for those who don't use Reddit. I also post a weekly prediction of the remainder of the season using updated PR and win probabilities averaged over 10,001 simulated seasons. I'll put up a separate post about predictions in the coming days. Happy to receive suggestions, questions and comments from new consumers of the Power Rankings or old heads. Enjoy :)
How much of an impact does a short turnaround or extra days rest have on your chances of winning in the NRL? The longer the rest, the lesser the home ground advantage.
Only 20 sleeps until BBL08 so I thought I'd take a quick look at what to expect from each and every ball based on the past seven seasons. Interesting to see the clear shift shown at the end of the powerplay with a drop in dot balls and fours - replaced by runs off the bat. 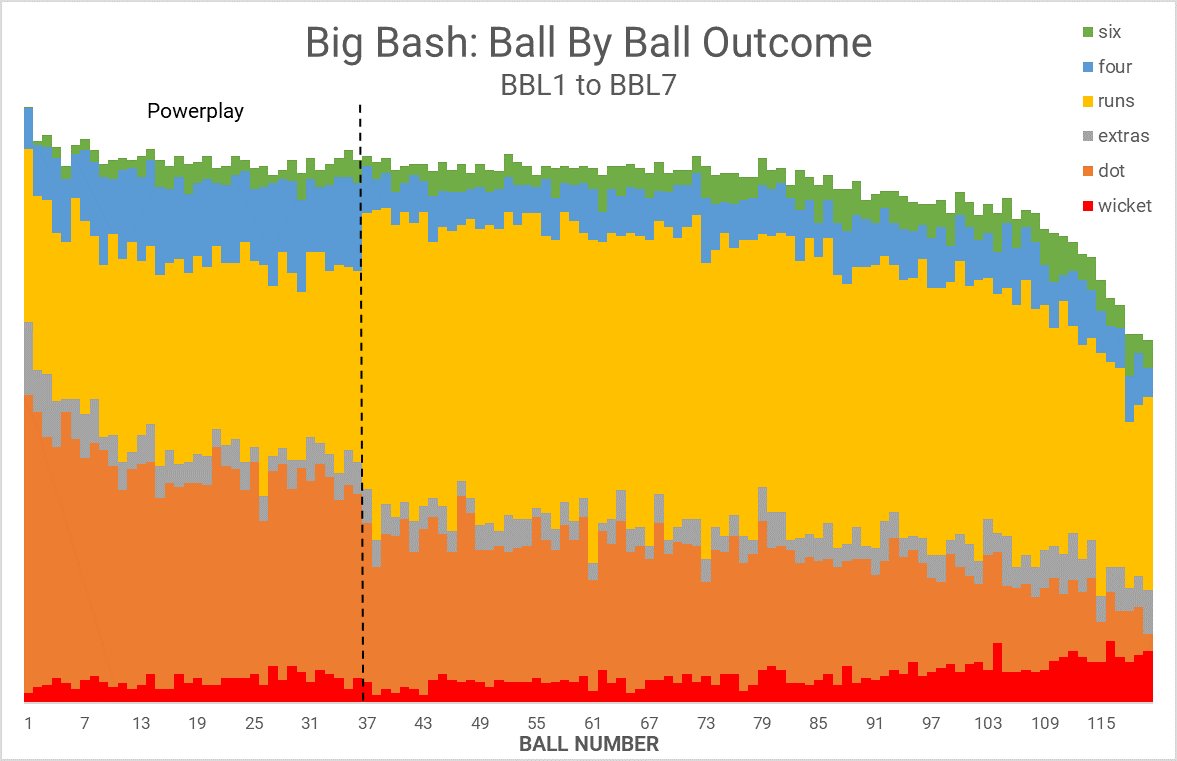 We all know the NRL Draw is unbalanced with teams not playing a full home and away schedule. There's also been talk about short turnarounds which the NRL has worked hard to try to balance. What we don't hear about is the massive discrepancy in travel. 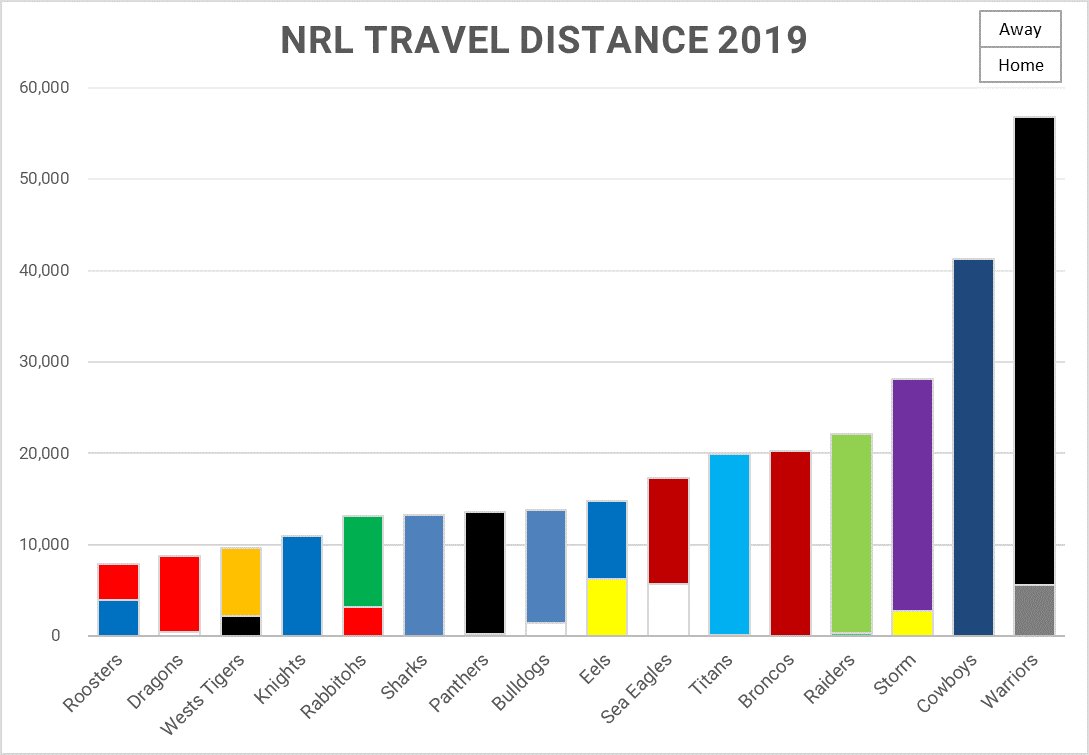 How often is the ball in play during an NRL game? According to NRL.com, it's 52 mins and 38 seconds on average in 2018. 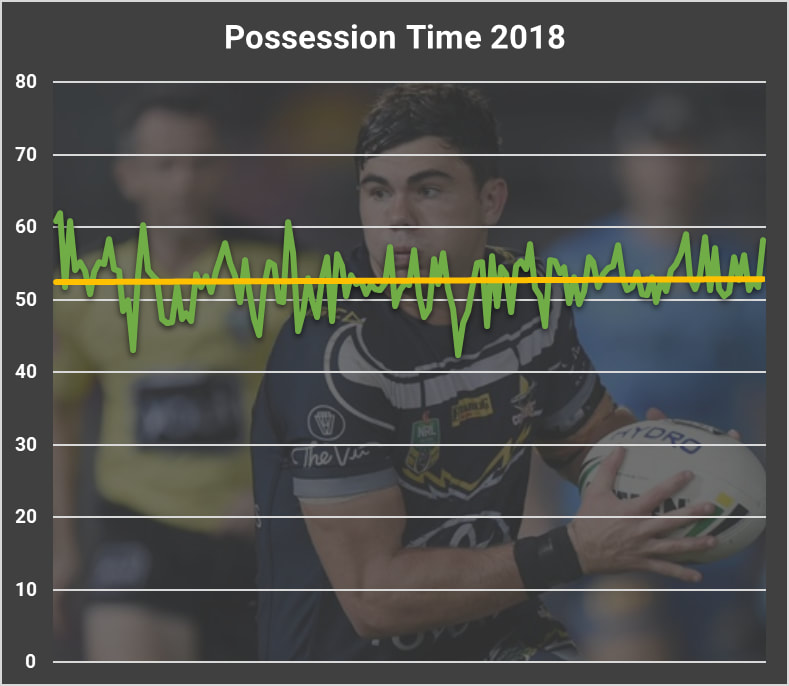 BBL08 draw has just been released with an expanded competition to include full home and away fixtures. With crowds dropping last season (except the Scorchers), games on the Gold Coast and a new broadcaster, it will be interesting to see how fans respond. 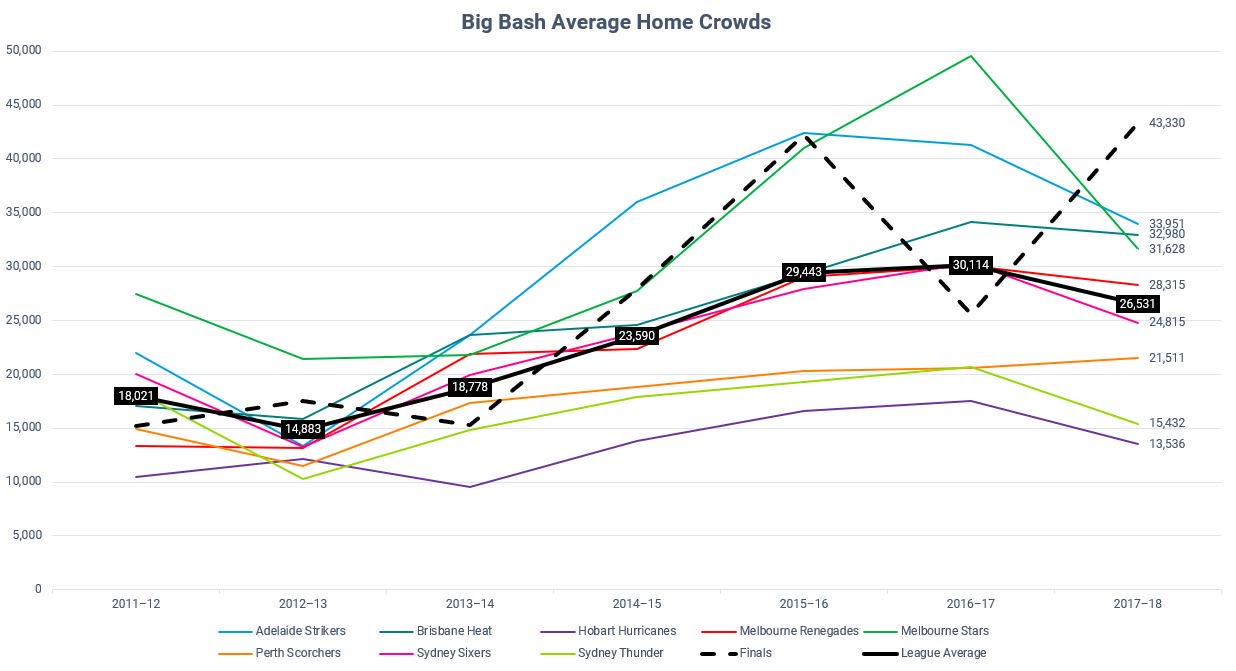 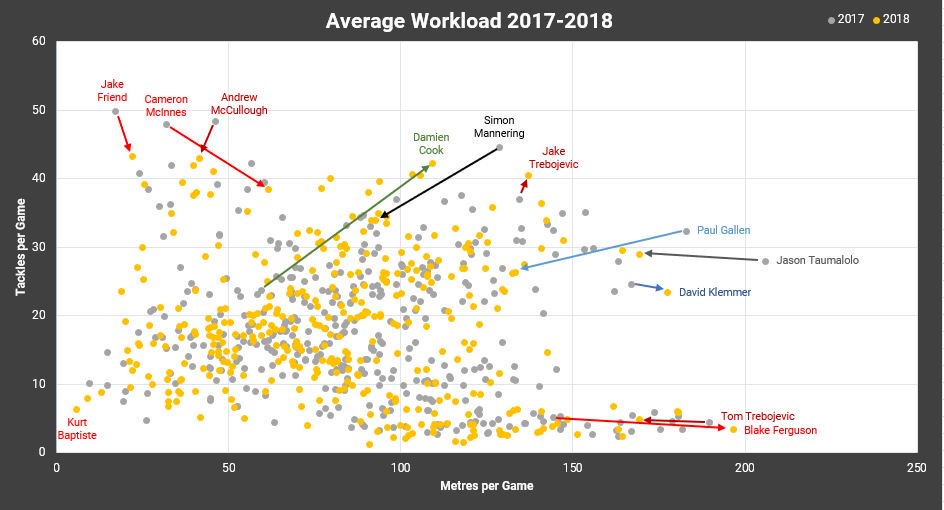 Who are the busiest workers in the NRL?
With the NRL season on the not too distant horizon, I've finished the draft redesign of my NRL Power Rankings system. Based on a standard Elo ranking, the system has changed many times since I started in 2015. Elements have been added, subtracted and adjusted leading to some significant changes for 2010.
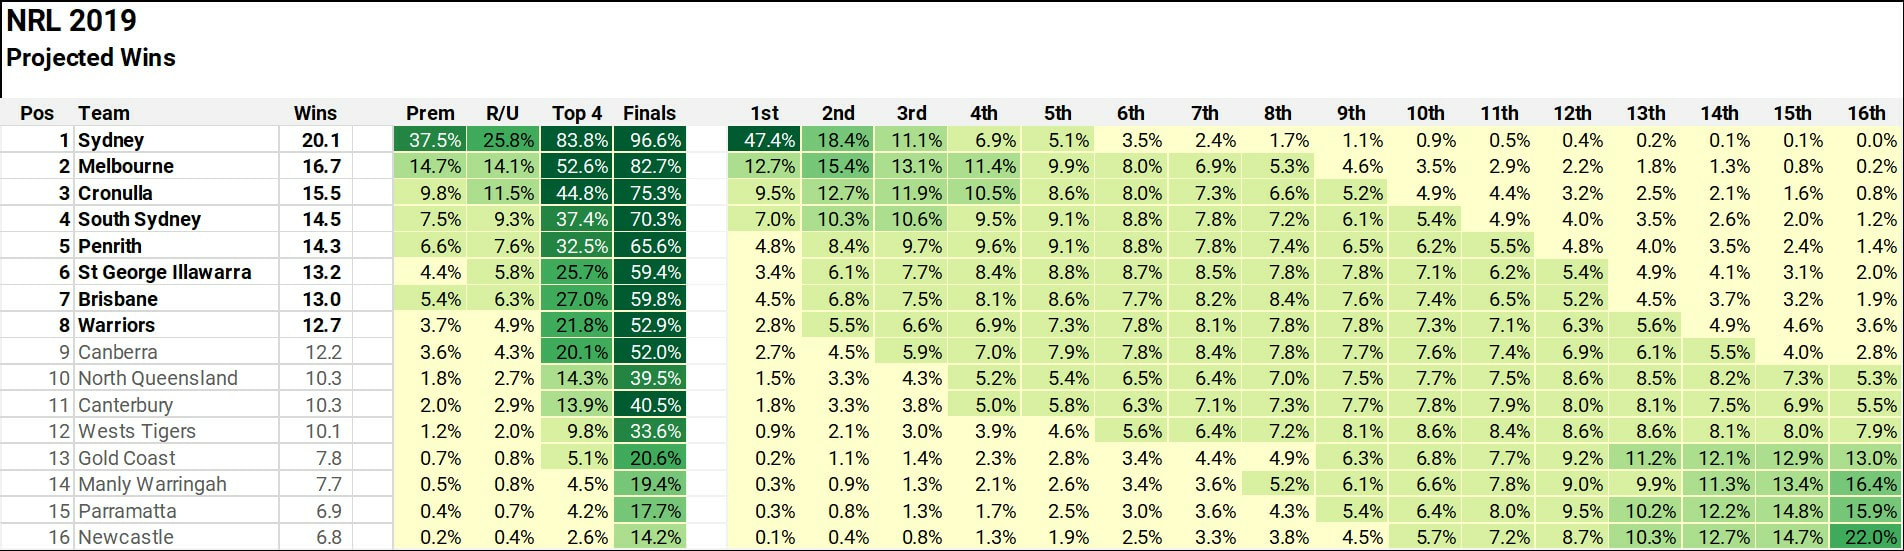
Scale I've converted the rating scale from the traditional 1,500 point median to a 50 point median. This allows for a more relatable 0-100 scale giving the reader a sense of not only the comparative ratings between teams and trends but also the theoretical maximum and minimum scores achievable. Presentation These rankings were originally hosted on the /r/NRL subreddit. This gave me an excellent and knowledgeable audience but has been limited by the presentation options of the Reddit platform. Moving to a web-based host allows me to use html and tools like Datawrapper. Audience The audience for the new NRL Power Rankings may change with the move to a stand-alone web-based platform. I'll continue to post in /r/NRL but will also be able to post to this site and Twitter more easily. Interaction from readers will continue to be very important. Feedback Feedback has been extremely important in development and bug-fixing. Without feedback, these Power Rankings may have fallen in a heap and certainly wouldn't be as refined as they are today. I welcome feedback, positive or negative. To tide you over until the new season kicks off, I've prepared a sample of the new Power Rankings below using last season's results and my favourite new toy, Datawrapper. There are still six weeks until the season starts so there could be plenty of changes before we go live. Enjoy! |
AuthorAll data is gathered from publicly available information - mostly from NRL.com, Rugby League Project and Wikipedia. No guarantees are made for the accuracy of data published. I do this purely for fun, as a sports and analytics fan. Archives
October 2020
Categories
All
|
 RSS Feed
